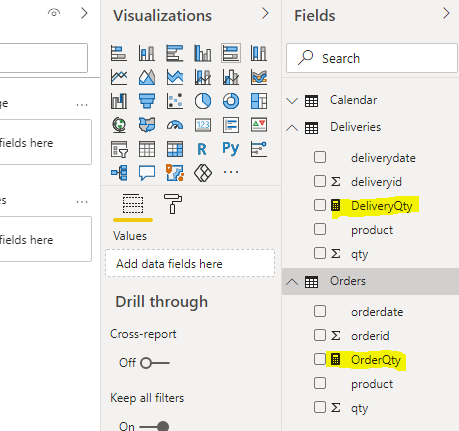
Organising all your measures into a report measure table is one of the best practices in Power BI for efficiently building and maintaining reports. For example, it can be difficult to determine what measures have been created in a report if they were created across multiple tables, as shown below.
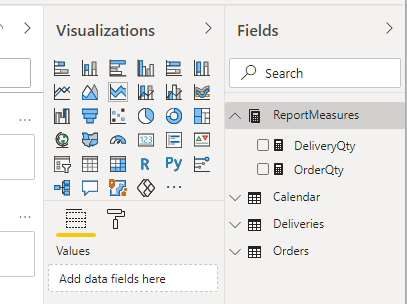
But if we organise them into a report measure table:
It is much easier to identify and maintain the measures in the report.
So let’s look at how we can create a report measure table.
Creating a Report Measures Table
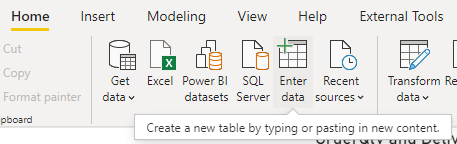
1. Click on Enter data under home tab to create a new table:
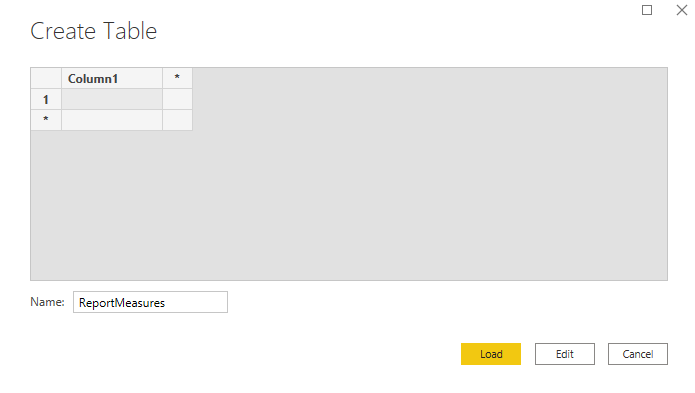
2. Name the table as ReportMeasures and click on Load (leave Column1):
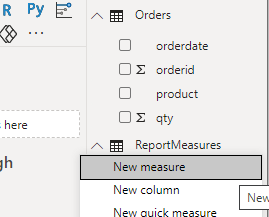
3.Right click on the ReportMeasures table and create your new measures (do not remove column1 at this stage):
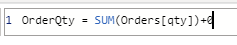
Your column reference will include full table name + column name:
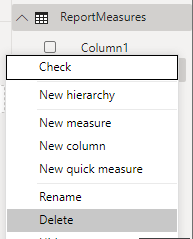
4. Now that the measures are created, go back and remove Column1. If you remove Column1 before having any measures, the table will no longer be visible from the table list. You can only remove that column after creating your measures.
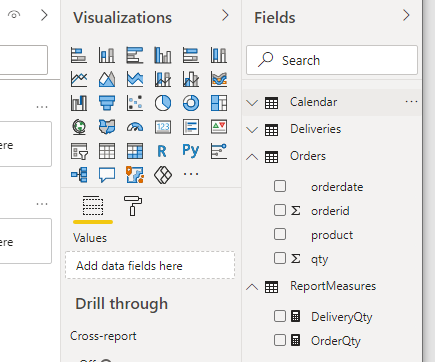
Your ReportMeasures table should now only contain the measures you have created:
5. Now save the Power BI report, close, and reopen it. The icon of the table will become a Measure icon and sit on the top of the table list. Your measure table is done.
Get Help From Microsoft Certified Experts
Discover how we can transform your business with our expertise in Power BI, Microsoft Fabric, and Azure solutions.