Discover the potential of analytics dashboards in our data visualisation gallery
Your Trusted Microsoft Partner
What is a Power BI dashboard?
Power BI dashboards make it easy to review all of your most important business metrics in a single interface. You can combine insights from multiple datasets on one intuitive and visually appealing screen. Check out some data visualisation dashboard examples in our Power BI gallery below.
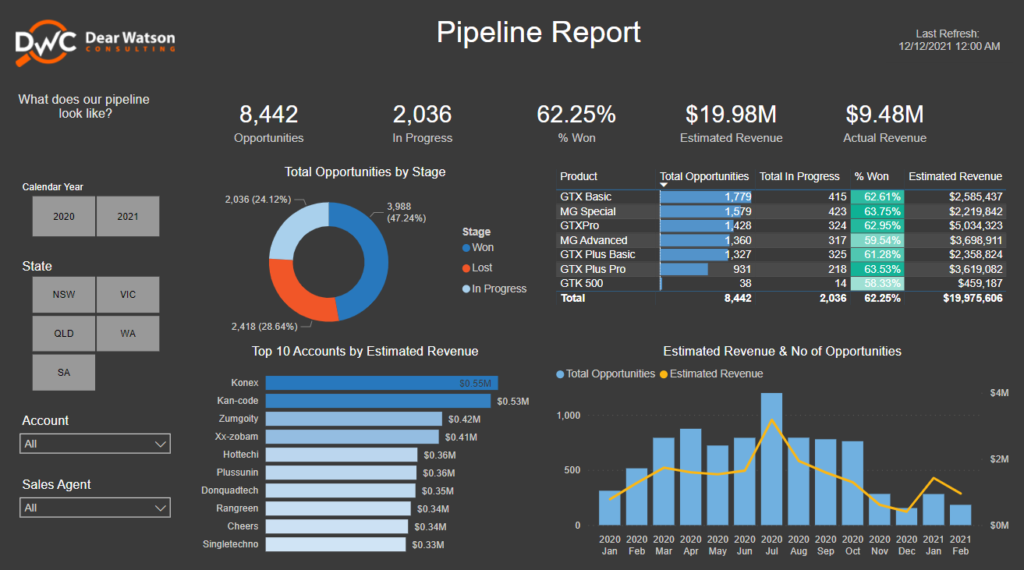
View your pipeline in real-time, including opportunities, product performance, top accounts and revenue, all filterable by location, year, account, and sales agent.
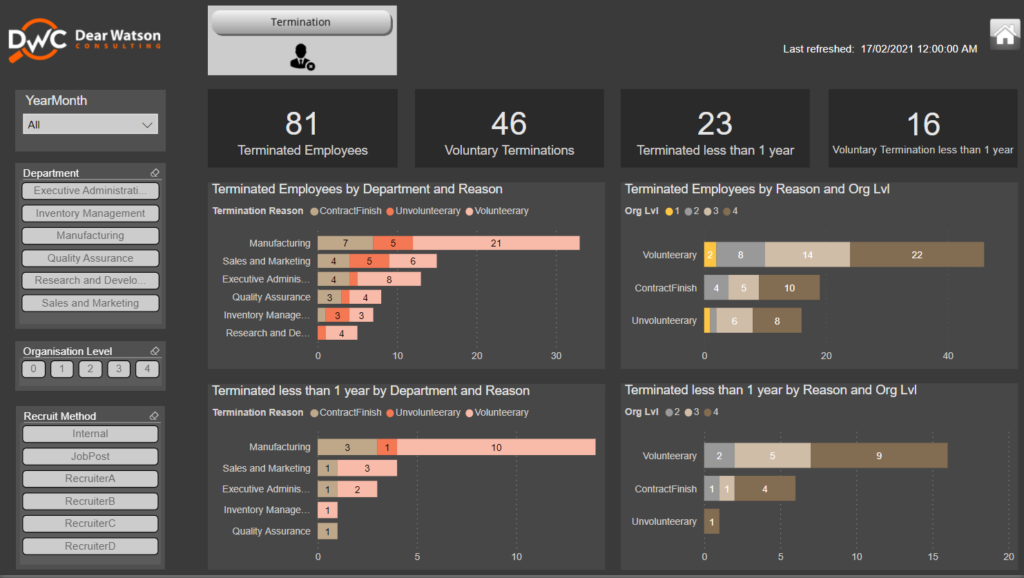
Get a dynamic overview of employee headcount by age, gender and location; personal leave and FTE; recruitment, including number of candidates and time taken to fill a position; and termination, including rates and reasons, all filterable by department and month.
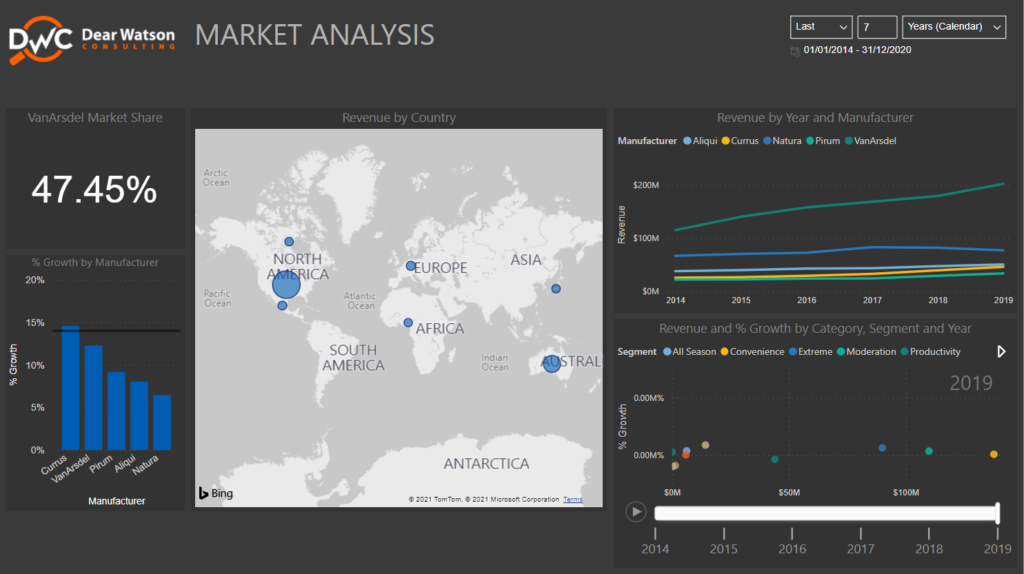
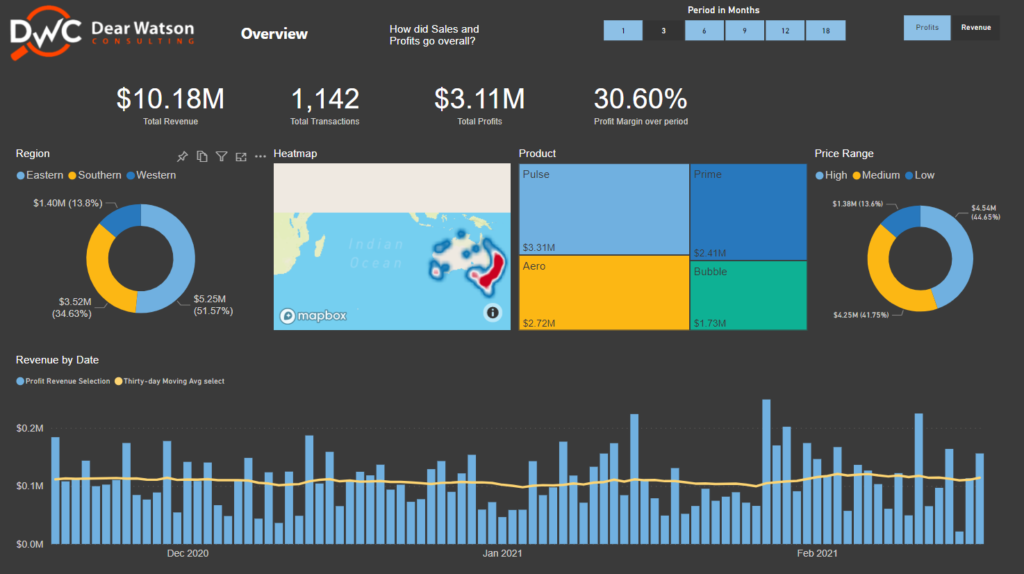
Analyse your market in real time, including revenue by country, market share, manufacturer, year, category, and segment, as well as tracking the status of KPIs.
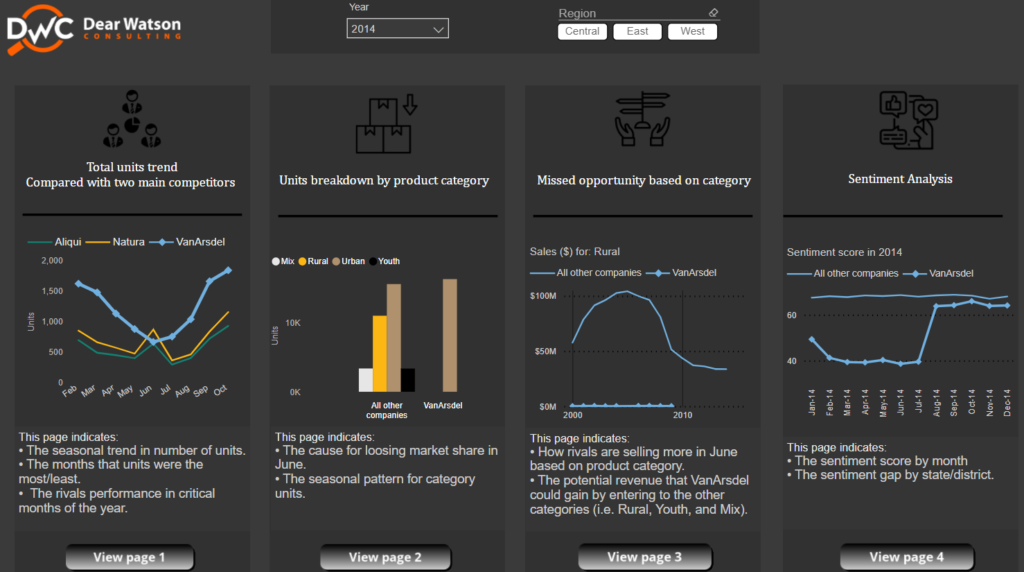
Gain rich sales insights covering seasonal trends, rival performance, missed opportunities, sentiment analysis, market share, revenue, and unit sales, all filterable by category, year, region, and segment.
View your pipeline in real-time, including opportunities, product performance, top accounts and revenue, all filterable by location, year, account, and sales agent.
Get a dynamic overview of employee headcount by age, gender and location; personal leave and FTE; recruitment, including number of candidates and time taken to fill a position; and termination, including rates and reasons, all filterable by department and month.
Analyse your market in real time, including revenue by country, market share, manufacturer, year, category, and segment, as well as tracking the status of KPIs.
Gain rich sales insights covering seasonal trends, rival performance, missed opportunities, sentiment analysis, market share, revenue, and unit sales, all filterable by category, year, region, and segment.
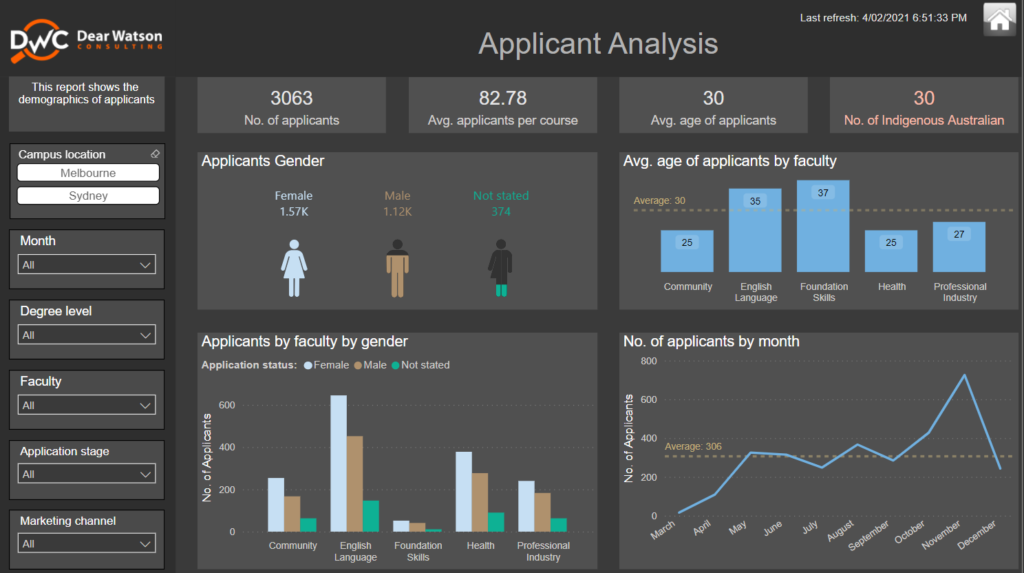
Track application numbers by faculty, month, gender and diversity, with options to filter by location, application stage and marketing channel enrolment rates.
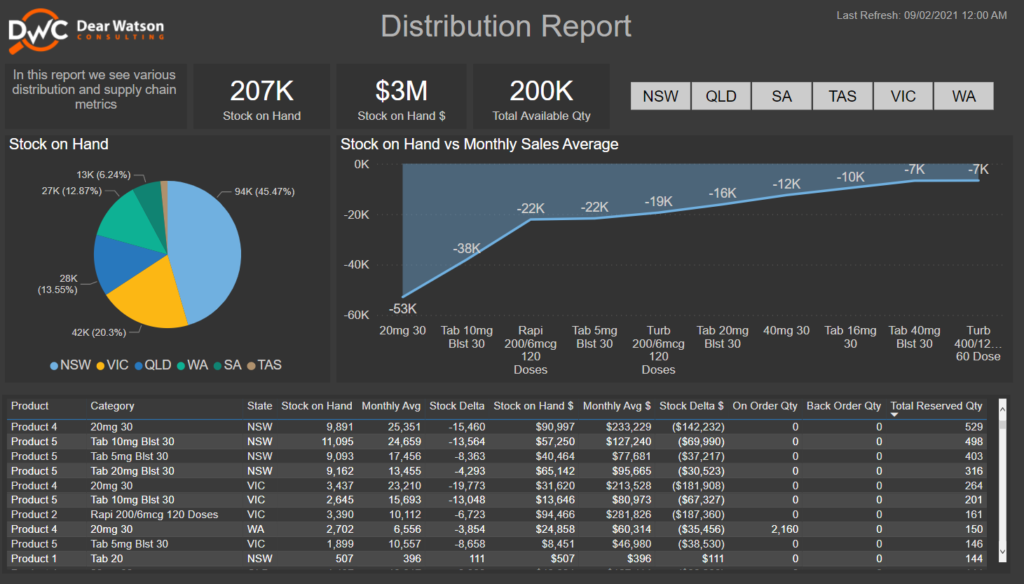
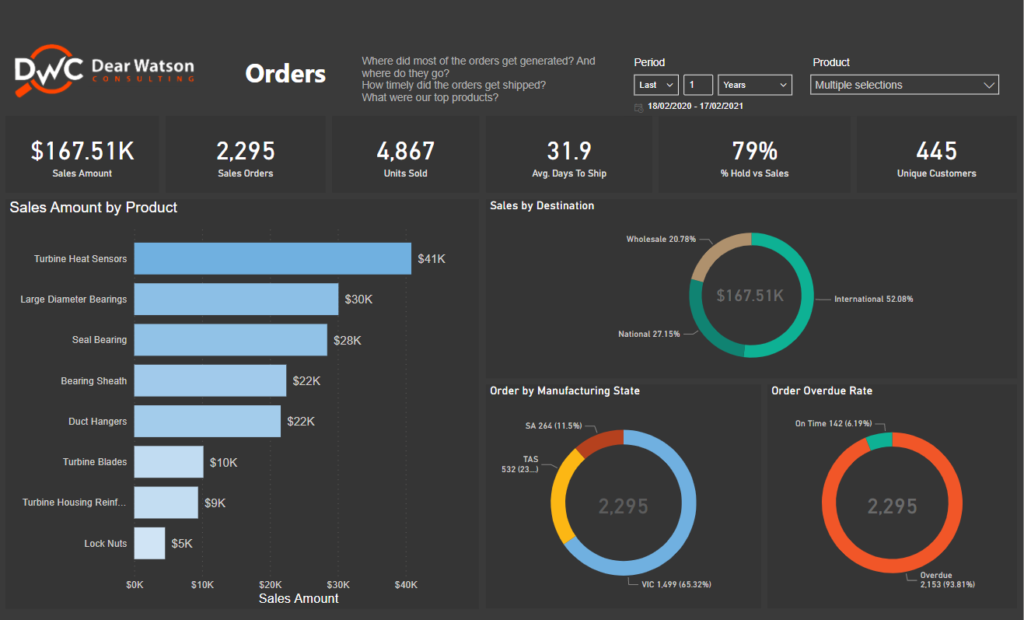
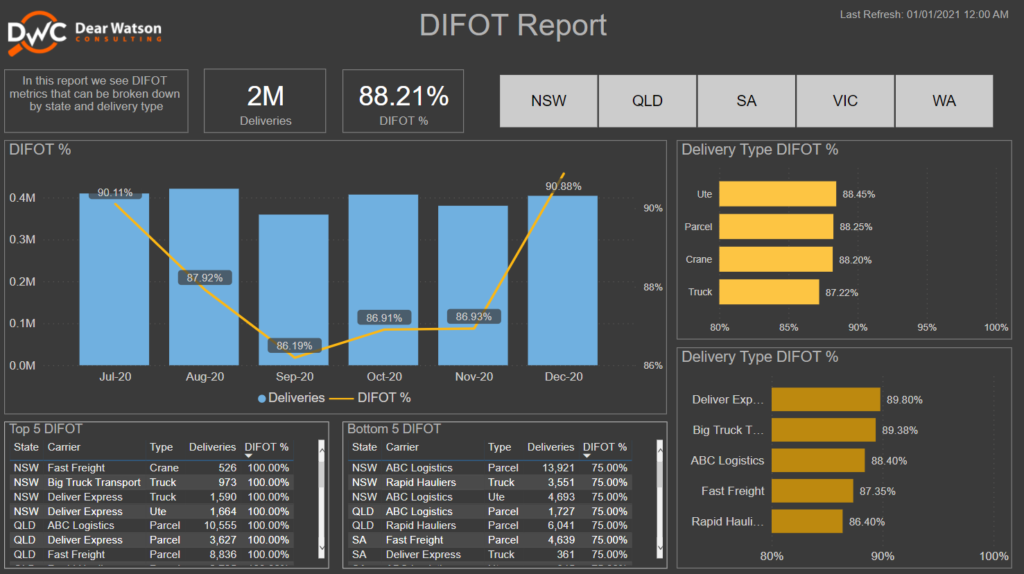
View production and sales metrics in real-time, including revenue, order numbers, units sold, average days to ship, hold versus sales, unit status and delays, and unique customers, plus gain insights on sales by product, destination and manufacturing location.
Track application numbers by faculty, month, gender and diversity, with options to filter by location, application stage and marketing channel enrolment rates.
View production and sales metrics in real-time, including revenue, order numbers, units sold, average days to ship, hold versus sales, unit status and delays, and unique customers, plus gain insights on sales by product, destination and manufacturing location.
If you’re struggling to create impactful Power BI reports or you don’t have a set of guidelines when starting a new project, then you could benefit from using our Power BI Report Development Checklist. It covers many aspects of starting a new Power BI reporting project and should be applicable in most cases.