Gauges in Power BI are some of the most appealing and impactful visuals in a digital dashboard. Users can quickly grasp progress toward any KPI, and this in turn facilitates informed decision making. Assigning colors to ranges within a gauge conveys information even more effectively. These are known as sentiment colors.
The Gauge visual does not immediately give the option of selecting sentiment colors based on the measured results. This blog will demonstrate how to apply conditional formatting logic to set the fill colors in Gauge visual and thereby add a sentiment to your dashboard gauges.
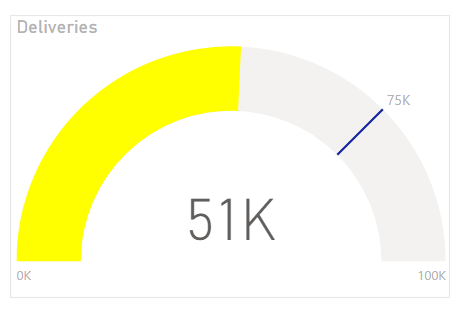
Below we see a default Gauge visual with some minor formatting done around data label sizes.
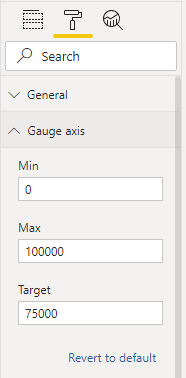
You can see that the Min, Max, and Target have also been set under Format tab > Gauge axis:
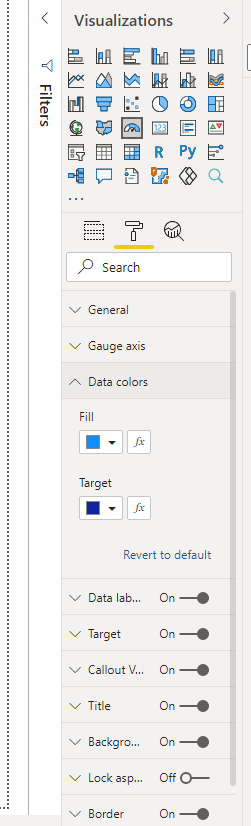
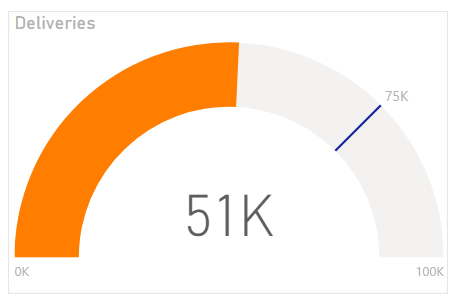
There is an option to use conditional formatting to change the colours to suit your needs. Under Format tab > Data colors, click on the ‘fx’ button to set the colour by rules.
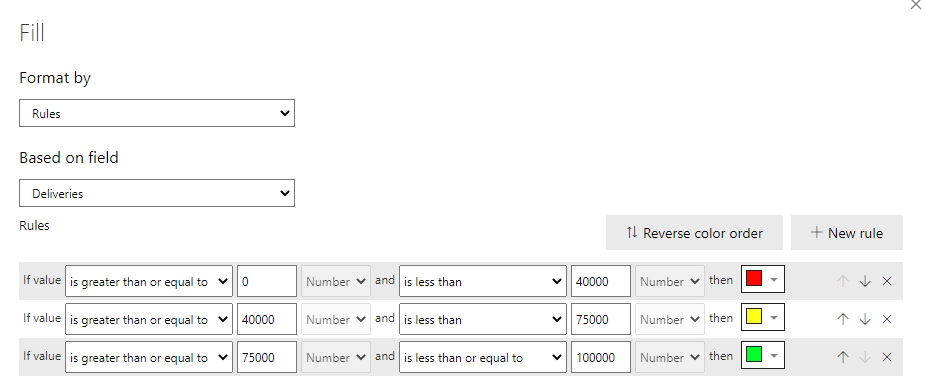
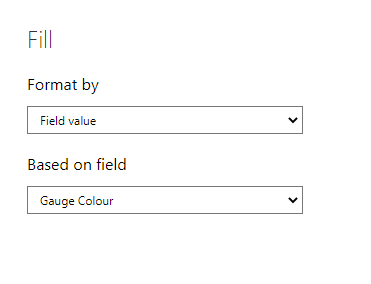
A typical red, yellow and green approach has been used here, though you can assign more than just three rules if needed. For complete customization, hexadecimal colors can be assigned here: Format by > Rules > Field value
DAX Solution
It can be quite time-consuming to repeat this process for multiple visuals. If the same logic applies, then we can use DAX to greatly speed up the process.
Using the SWITCH function we can write a measure that will allow us to achieve this.
There might also be a need to use exact colours, to match existing KPI visuals. This can be achieved by entering the specific HEX colour you want into the Gauge Colour measure.