If you’ve just started using Microsoft Power BI, get ready for transformative analytics abilities. But first, you’ll need to get your head around the platform’s many features. For those new to the service, the various tools can be confusing. The good news is that many of them are also available in the familiar Excel application, using a pair of Microsoft add-ins, Power Query and Power Pivot.
So, what are the differences between Power BI vs Power Query vs Power Pivot, and how do they all connect? Read on to find out.
What is Power Query?
Power Query is a tool for extracting, transforming and loading data in Excel and Power BI.
It can import and connect data from various external sources, including CRMs, databases, Azure, emails, files, cloud storage, social media, websites, and more. Pre-programmed tools can then be used to clean and shape the data, converting it into an Excel-friendly sheet format. The results can be loaded into Excel, Power BI, or a Power Pivot Data Model (explained below).
When selecting a data source to import into Power Query, you can either load it directly or launch the Query Editor to apply ‘transformations’ that refine your data and facilitate analysis. Featured transformations include removing duplicates and empty cells, removing columns, replacing values, merging tables, changing data type, and more. Each transformation you perform will be recorded under Applied Steps — these steps can be reversed to undo an action.
Power Query uses the functional, case-sensitive Power BI query language ‘M’ (a.k.a. Power Query ‘Mashup’ language) to carry out its tasks. Although this underlying coding is hidden behind a graphical interface, advanced users can access and manually manipulate it via the Formula Bar or Advanced Editor function. This can enhance functionality and flexibility beyond what is possible in the graphical interface.
What is Power Query used for? With its easy-to-use graphical interface and Excel compatibility, Power Query provides a highly efficient way to combine different data sources and sort them into a usable format, ready for analysis. It is best for preparing sizable but uncomplicated datasets, and is particularly useful for those who lack coding capabilities or specialised knowledge in business intelligence platforms like Power BI. By connecting to external data sources, it is also capable of handling far larger datasets than Excel can typically accommodate.
Power Query is particularly notable for its Refresh and Duplicate commands — invaluable time savers that allow users to repeat, update and adjust queries based on the same data connections at the click of a button.
Now let’s take a look at Power Pivot.
What is Power Pivot?
Power Pivot is a sophisticated data analysis and modeling tool in Excel and Power BI. It allows you to combine and analyse data from many different sources into a Data Model, then share your insights.
So what is the difference between Power Pivot and Power Query? The two tools are independent and do not necessarily need to be used together, but their functions complement one another. While Power Query is used in the initial phases of data analysis to import and shape data, Power Pivot is able to carry out advanced calculations and data modeling.
What is Power Pivot used for? Power Pivot is great for drawing relationships between large datasets, tracking KPIs, identifying trends, and visualising findings in sharable insights.
Though Power Pivot operates as part of Excel, it is far more powerful than its host. Power Pivot is capable of loading hundreds of millions of large datasets into a single workbook. It can then rapidly perform advanced calculations and create interactive visualisations using the DAX (Data Analysis Expressions) modelling language.
Various default functions exist to aggregate, filter and compare data, however it is possible to write your own advanced formulas in DAX. The Diagram view provides an overview of the entire data model. Here, users can draw relationships between multiple tables by simply dragging and dropping fields. Data can then be visualised and patterns highlighted using conditional formatting tools, such as colour scales.
Tables can be further refined using Hierarchies, which place multiple, related fields — such as year, month, and date — into an expandable column, making it easy to filter information and drill down into the details. Dynamic one-click filtering controls called Slicers can also be used to control which data appears in tables and charts, so users can interactively filter and analyse datasets within seconds. Power Pivot’s Perspective feature offers another way to distill large datasets by allowing users to provide custom views to specific user groups.
As well as being utilised within Excel, Power Pivot’s interactive insights can be published in Power BI.
What is Power BI?
Power BI is a separate business intelligence tool that incorporates both Power Query and Power Pivot. It is capable of transforming data from disparate sources into cohesive, interactive visual insights and reports that can be shared in a collaborative online workspace. Both M and DAX are supported as Power BI query languages.
Power BI is split into two tools: Power BI Desktop and Power BI Service (i.e. PowerBI.com). Like Excel, Power BI Desktop uses Power Query to import and clean data, and Power Pivot to analyse and model data. For many users, Excel is a familiar, legacy platform and therefore preferable over Power BI for use with Power Query and Power Pivot. However, Power BI provides more connection options and superior visualisation capabilities.
As well as facilitating highly interactive reports, Power BI can be used to create ‘dashboards’, which combine insights from multiple datasets on one intuitive and visually appealing screen. This makes it easy to review important business metrics in a single interface.
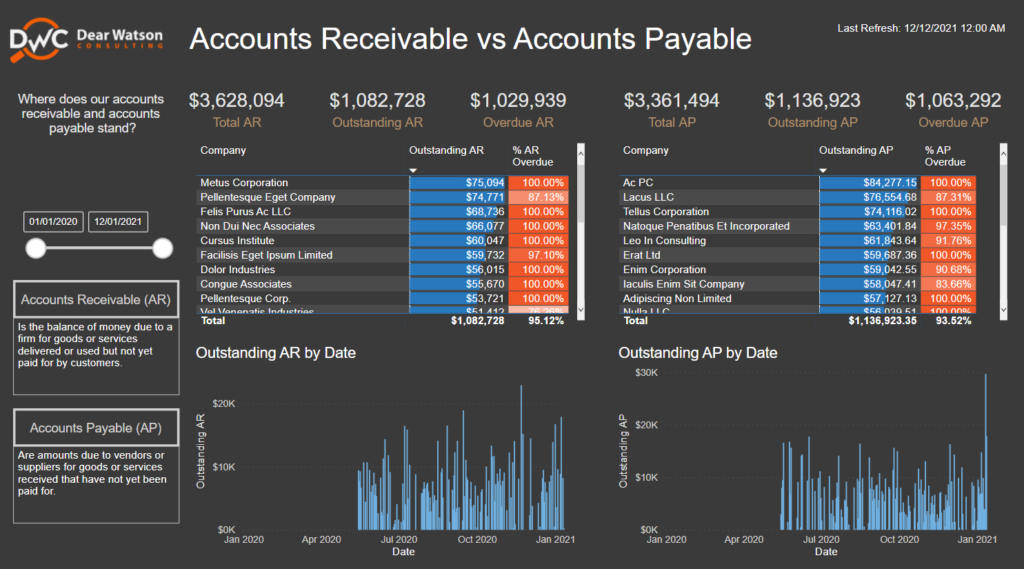
You can find more examples of Power BI dashboards here.
Insights from Power Pivot can be pinned to these interactive dashboards alongside other visualisations, such as charts, maps, KPIs, Q&As, slicers, tables, and custom graphics.
Once reports and dashboards have been created in Power BI Desktop, they can be published to the cloud-based Power BI Service, where team members can collaborate on them from any device in real-time.
Need help with Power BI?
If you need help mastering these tools, Dear Watson Consulting offers Power BI training and mentoring services both in person and online. As Australia’s leading Power BI specialist and a Microsoft Gold Partner in Data Analytics, we can guide you through the basics of Power BI to the intricacies of advanced reporting. Contact us today to find out more.