It’s a quirk of international business that countries measure their financial years differently from the calendar year and from each other. In the US, the fiscal year starts October 1 and ends September 30. In New Zealand, Japan, the UK, and Canada, the fiscal year is from April 1 to March 31. The sensible Europeans do use the January-to-December calendar year for their finances, but Australia’s July-to-June financial year couldn’t be any more different.
For every business, there will always be the need to measure multiple performance metrics in the context of financial year to date (FYTD). Power BI makes these kinds of measurements extremely easy, but there are some things you should know:
- In Power BI there are multiple built-in year-to-date (YTD) measures that are easy to use.
- By default these use the calendar year, with January 1st as the start date. But Australian businesses will likely want to use the Australian financial year, beginning July 1 and ending June 30.
These means YTD setting will need to changed from the defaults. This short guide will walk you through the process of configuring Power BI to output your measurements for Australian FYTD.
Use TOTALYTD to organize your data for the Australian financial year
Note: You will need a calendar or date table in your report model for these measures to work.
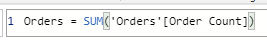
We start off with a simple measure to get the sum of orders:
We then use the TOTALYTD function to get the YTD number. The date at the end of the measure should be the last day of the reporting year.
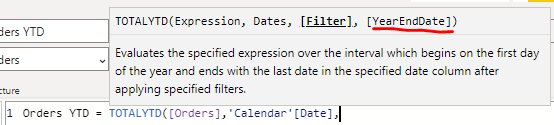
The date should be entered as below:

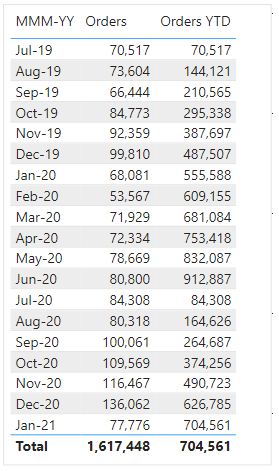
As we can see in the following data table, the Orders YTD cumulative measure now starts on July 1st of any given year. For this company, the 2019 financial year starts with over 70,000 orders in July. Orders accumulate steadily until peaking at over 900,00 at the end of June, the financial year end. The row for July 2020 data shows the financial year-end reset. Orders for that month – the first of the financial year – are 84,000 and begin accumulating again over each month of FY2020. The Total Orders YTD is showing 704,561, which is the accumulation since July 2020.
For another perspective, the same Orders YTD data is graphed below.