In a world increasingly driven by data, businesses of all sizes face the same challenge: how to transform a sea of raw numbers into actionable insights. That’s where Power BI steps in. Developed by Microsoft, Power BI is a business intelligence platform that doesn’t just crunch numbers—it tells stories with data. Imagine taking an ordinary spreadsheet or a massive database and turning it into a visually engaging report or a real-time dashboard that anyone can understand. That’s the magic of Power BI.
But what exactly is Power BI? At its core, Power BI is a suite of tools designed to help businesses make sense of their data. Whether you’re a solo entrepreneur juggling sales metrics or a global enterprise tracking supply chain performance, Power BI empowers you to connect, visualize, and share data insights with ease. It’s not just a tool—it’s your data’s storyteller.
A Seamless Ecosystem for Data Insights
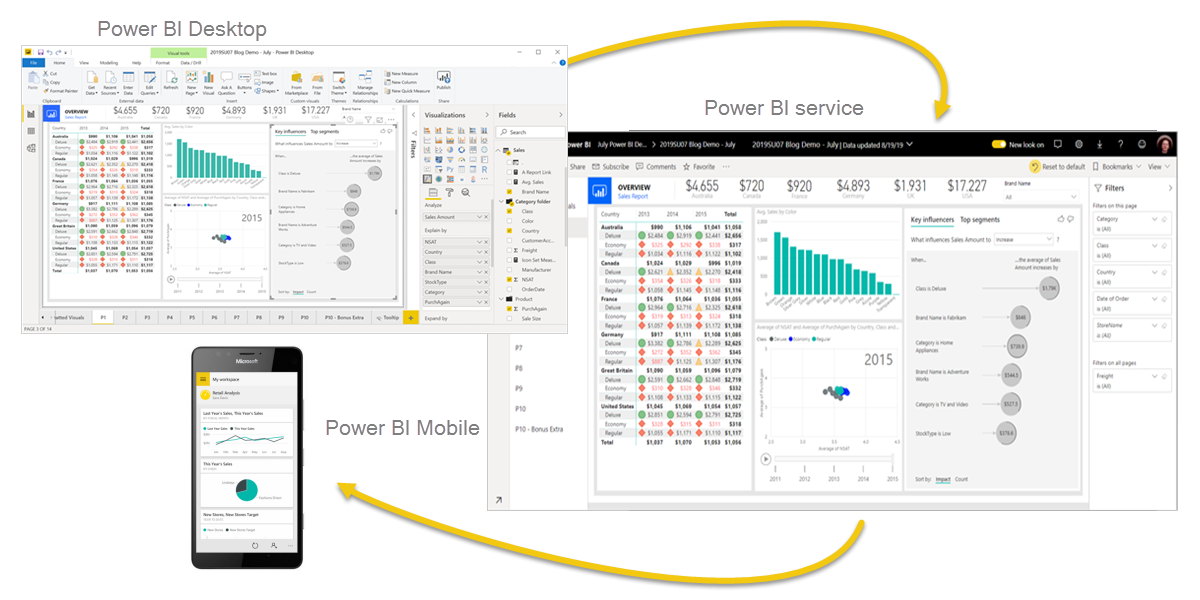
Power BI isn’t a one-size-fits-all solution; it’s a carefully designed ecosystem that adapts to your needs. It begins with Power BI Desktop, a free application that lives on your computer. This is where you can connect to various data sources, clean and transform your data, and create detailed reports. Think of it as your creative studio.
Once your masterpiece is ready, you can upload it to the Power BI Service, a cloud-based platform where your reports come to life. Here, you can share insights with colleagues, create interactive dashboards, and collaborate in real time. It doesn’t stop there. With the Power BI Mobile app, you can take your data on the go, whether you’re presenting to clients or tracking metrics during your morning coffee.
What makes Power BI stand out is its flexibility. Whether you’re working on desktop, cloud, or mobile, the tools work together seamlessly, adapting to your role and goals.
How It Works in Action
Let’s say you’re a sales manager trying to identify trends in your quarterly performance. You start by connecting Power BI to your sales database—no coding required. From there, you clean and prepare the data, eliminating errors or duplicate entries. Then comes the fun part: creating visuals. With just a few clicks, your rows and columns of numbers become dynamic charts, heat maps, and graphs.
But it doesn’t stop at visuals. It lets you dive deeper. By applying filters, you can analyze performance by region, product line, or sales representative. Want to understand why one product is outperforming another? Drill down into the data and uncover insights in seconds. Once your dashboard is ready, you can share it with your team through the Power BI Service or monitor it on your phone using the mobile app. Suddenly, your data isn’t just numbers—it’s a story, a strategy, a roadmap.
Why Power BI is a Game-Changer
Power BI’s real superpower lies in its ability to cater to everyone—from data analysts to CEOs. You don’t need to be a tech wizard to use it. Its intuitive design ensures that even beginners can create impressive reports in no time. Yet, for advanced users, Power BI offers features like DAX (Data Analysis Expressions) and custom visuals to push the boundaries of data analysis.
The tool also stands out for its integrations. It connects effortlessly with Microsoft’s ecosystem, including Excel, Teams, and SharePoint. But it’s not limited to Microsoft products—it can pull data from over 100 sources, from SQL databases to Salesforce. This versatility makes it a favorite across industries, whether you’re in healthcare, retail, or finance.
A Glimpse into the Future
The beauty of Power BI isn’t just what it can do today—it’s how it evolves. Microsoft regularly updates Power BI, introducing new features driven by user feedback. From AI-powered analytics to real-time data monitoring, it continues to set the bar for business intelligence tools. Imagine asking a question like, “What were our top-selling products last quarter?” and getting an instant visual answer. With Power BI, this isn’t the future—it’s the present.
Your First Steps
Getting started is simple. Begin by downloading Power BI Desktop—it’s free and easy to use. Experiment with connecting to your data sources, whether it’s an Excel file or a database. Build your first report, play with visuals, and see how your data transforms before your eyes. Once you’re ready, share your creation through the Power BI Service or access it on your phone with the mobile app.
Power BI doesn’t just make your data accessible; it makes it actionable. In a world where insights drive success, having the right tools can make all the difference. Power BI is that tool. It’s time to take control of your data and let it guide your decisions.
Ready to Harness the Power of Your Data?</strong>
Power BI is more than a tool—it’s a game-changer for businesses looking to transform data into insights. Whether you’re just starting or want to optimize your current reporting processes, our team of Power BI experts is here to help.
Contact us today to learn how we can help you implement, customize, and maximize the potential of Power BI for your organization. Let’s make your data work smarter, together.

